Uncategorized files
Jump to navigation
Jump to search
Showing below up to 437 results in range #1 to #437.
View (previous 500 | next 500) (20 | 50 | 100 | 250 | 500)
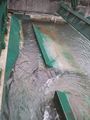
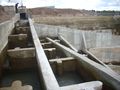 11 Upstream-part-of-fishway-in-Guma-dam.jpg 2,560 × 1,920; 2.3 MB
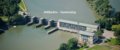
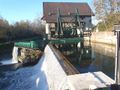
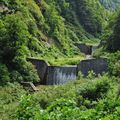
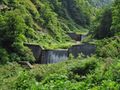
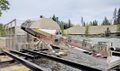
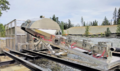
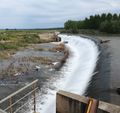 1 Guma-dam-in-spring.jpg 1,271 × 1,195; 452 KB
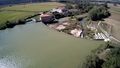
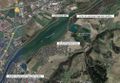
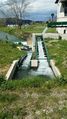
 2 Top-view-of-Guma-fishway.jpg 1,920 × 1,080; 428 KB
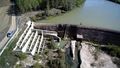
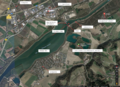
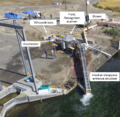
 3 Top-view-of-Guma-hydropower-the-reservoir-and-the-fishway.jpg 1,920 × 1,080; 351 KB
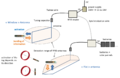
 3d Sensorless ultrasound setup.png 597 × 657; 918 KB
 3d Sensorless ultrasound setup square.png 206 × 206; 80 KB
 3d fish tracking 3d ouput.jpg 1,346 × 1,094; 219 KB
 3d fish tracking equipment.jpg 1,387 × 514; 154 KB
 3d fish tracking fish tracks.jpg 1,305 × 711; 134 KB
 3d fish tracking installation1.jpg 1,772 × 1,181; 1.39 MB
 4 Vadocondes-fishway.jpg 780 × 1,040; 965 KB
 5 Bottom-part-of-Vadocondes-fishway.jpg 1,040 × 780; 98 KB
 ABM results 1.png 405 × 259; 239 KB
 ABM results 2.png 607 × 412; 445 KB
 Adcp example units.png 1,198 × 521; 450 KB
 Adcp output.png 1,283 × 959; 1.94 MB
 Adcp qboat.png 486 × 364; 382 KB
 Adcp workflow.png 3,779 × 1,653; 1.29 MB
 Adcp wse.png 731 × 312; 15 KB
 Adv down.png 449 × 806; 192 KB
 Adv main components.png 482 × 884; 416 KB
 Adv nortek probe.png 491 × 854; 181 KB
 Adv sontek probe.png 802 × 811; 453 KB
 Air bubble curtain square.png 415 × 415; 273 KB
 Altheim demo.png 1,488 × 621; 1.78 MB
 Altheim layout.png 1,500 × 1,091; 3.95 MB
 Altheim migration layout.jpg 1,002 × 697; 305 KB
 Altheim natural fishway.jpg 4,032 × 3,024; 3.59 MB
 Altheim natural fishway downstream.jpg 2,126 × 1,415; 2.25 MB
 Altheim overview.jpg 900 × 596; 213 KB
 Altheim structure 1.jpg 6,000 × 4,000; 6.41 MB
 Altheim structure 2.jpg 5,520 × 3,680; 4.97 MB
 Altheim underwater.jpg 4,640 × 3,480; 2.89 MB
 Angled rotary drum screen.png 819 × 504; 21 KB
 Anundsjö fishpass intake.jpg 4,032 × 3,024; 3.51 MB
 Anundsjö fishway.jpg 1,131 × 636; 282 KB
 Anundsjö floating migration.png 650 × 488; 769 KB
 Anundsjö layout.png 1,141 × 818; 727 KB
 Anundsjö reservoir.jpg 4,032 × 3,024; 1.84 MB
 Anundsjö spillway.jpg 2,442 × 1,305; 806 KB
 Archimedes screw belgium square.png 1,020 × 1,020; 1.47 MB
 Areal-view-HPP-Freudenau c Verbund.jpg 1,920 × 750; 358 KB
 Armored substrate.png 641 × 390; 679 KB
 Bannwil Layout.png 1,071 × 709; 1.73 MB
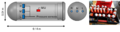 Barotrauma detection unit.png 946 × 256; 197 KB
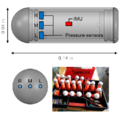 Barotrauma detection unit square.png 514 × 514; 163 KB
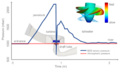 Barotrauma timeseries.png 1,290 × 757; 301 KB
 Barrier removal Norway square.png 795 × 795; 1.12 MB
 Barrier removal norway.png 1,353 × 802; 2.47 MB
 Basement 1d 2d.png 866 × 566; 354 KB
 Basement gui.png 632 × 632; 32 KB
 Basement logo.png 401 × 138; 34 KB
 Basemet qgis.png 1,579 × 1,109; 1.14 MB
 Bjorset regulated square.png 434 × 434; 40 KB
 Bms sensor.png 1,970 × 603; 943 KB
 Bms vortex tube.png 1,386 × 474; 995 KB
 Bms vortex tube2.png 1,325 × 604; 1.84 MB
 Braado weir-and-river.jpg 3,264 × 2,448; 3.23 MB
 Bragado Layout1.png 1,256 × 797; 2.11 MB
 Bragado Layout2.png 1,354 × 555; 90 KB
 Bragado canal.jpg 2,448 × 3,264; 2.47 MB
 Bragado fish survey.jpg 3,000 × 2,250; 4.52 MB
 Bragado low flow.jpg 3,000 × 2,250; 5.61 MB
 Bragado powerhouse-and-penstock.jpg 1,502 × 994; 266 KB
 Bragado river-Avelames-downstream-the-powerhouse.jpg 1,500 × 1,125; 2.29 MB
 Bragado weir.jpg 1,500 × 1,125; 1.55 MB
 Building block method.png 1,145 × 606; 95 KB
 CBR schematic.jpg 4,252 × 1,700; 550 KB
 COSH parameters.JPG 1,075 × 671; 108 KB
 COSH peak3.jpg 960 × 886; 210 KB
 COSH peaks.png 1,194 × 444; 59 KB
 COSH peaks2.png 1,190 × 436; 85 KB
 COSH peaks3.png 920 × 670; 370 KB
 Case locations.png 419 × 485; 112 KB
 Casimir fish.png 1,329 × 696; 745 KB
 Casimir gui.jpg 1,185 × 883; 335 KB
 Casimir hydropeaking.png 1,426 × 596; 486 KB
 Casimir interface.png 1,330 × 1,041; 415 KB
 Casimir migration.png 1,214 × 628; 427 KB
 Cassiopee baffle fishway.png 1,212 × 1,010; 534 KB
 Cassiopee las rives.png 1,042 × 827; 909 KB
 Classical bottom intake.jpg 794 × 1,059; 281 KB
 Classification table.xlsx ; 18 KB
 Cleaning substrate ripper.png 573 × 308; 464 KB
 Coanda schematic.png 673 × 702; 172 KB
 Coanda screen byro.png 452 × 926; 466 KB
 Coanda screen byro square.png 404 × 404; 338 KB
 Cosh tool light.png 581 × 401; 186 KB
 Cosh tool lundesoka.png 768 × 402; 745 KB
 Cosh tool parameters.png 637 × 612; 26 KB
 Cosh tool peaks day.png 1,032 × 379; 64 KB
 Cosh tool peaks hour.png 936 × 357; 43 KB
 Crushed bds tube.jpg 1,387 × 925; 503 KB
 Current meter operator.png 383 × 453; 423 KB
 Current meter section.png 876 × 544; 19 KB
 Current meter types.png 1,075 × 324; 166 KB
 Curved bar rack 3d.png 1,176 × 1,176; 2.28 MB
 Cy3igs5iu1w5taj2qsemv5wzsowmcjv.jpg 393 × 393; 97 KB
 DSS flow.png 573 × 828; 223 KB
 DSS flow web.jpg 2,046 × 1,092; 277 KB
 DSS flow web.png 2,046 × 1,092; 583 KB
 DSS link.png 271 × 106; 3 KB
 DSS logo.png 480 × 481; 10 KB
 DSS picture.PNG 725 × 1,019; 200 KB
 DSS step 1.jpeg 961 × 383; 106 KB
 DSS step 1.svg 961 × 383; 111 KB
 DSS step 1 SS.jpeg 1,587 × 778; 145 KB
 DSS step 2.jpeg 955 × 383; 129 KB
 DSS step 2 SS.jpeg 1,589 × 779; 139 KB
 DSS step 3.jpeg 960 × 383; 126 KB
 DSS step 3 SS.jpeg 1,585 × 777; 158 KB
 DSS step 4.jpeg 961 × 383; 135 KB
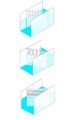
 Dam flow layers.png 492 × 305; 50 KB
 Dam velocity.png 534 × 204; 44 KB
 Dead wood shelter.png 839 × 410; 914 KB
 Deadwood square.png 399 × 399; 415 KB
 Denil fishway square.png 360 × 360; 253 KB
 Destroyed bank protection.jpg 527 × 527; 394 KB
 Devices-for-upstream-and-downstream-migration-at-Trois-Villes.png 873 × 579; 759 KB
 Dilution gauging2.png 720 × 540; 951 KB
 Dilution gauging3.png 712 × 538; 1.01 MB
 Downstream icon.png 396 × 396; 317 KB
 Downstream migration mesh rack.png 974 × 749; 1.37 MB
 Downstream migration square.jpg 494 × 494; 124 KB
 Downstream view of Iller (c) Ine Pauwels INBO.jpg 4,128 × 2,322; 1.3 MB
 E-flow.png 567 × 422; 518 KB
 E-flow square.png 1,303 × 1,301; 2.13 MB
 E4dv386zxl4as7n7baevi8kt0nz2toi.png 466 × 332; 438 KB
 Eel injury.png 884 × 249; 370 KB
 Eel pass france square.png 924 × 924; 1.64 MB
 Eel track.png 640 × 367; 300 KB
 Eelpass-troisvilles.jpg 1,920 × 2,560; 1.5 MB
 Eels pass france.png 1,098 × 927; 2.31 MB
 Eggs gravel.PNG 466 × 332; 438 KB
 Eicher screen.png 907 × 407; 30 KB
 Env design embankments otta.png 1,369 × 1,027; 2.44 MB
 Erosion square.jpg 949 × 949; 415 KB
 Excavator.png 1,072 × 406; 1.06 MB
 FGS layouts.jpg 6,296 × 3,083; 4.9 MB
- FIThydro SMTD template.docx ; 534 KB
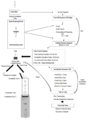
 FPNM guma.png 298 × 356; 293 KB
 FPNM guma 2d.jpg 291 × 354; 13 KB
 FPNM guma 3d.jpg 358 × 299; 24 KB
 FPNM guma aerial.jpg 557 × 605; 103 KB
 FPNM isosurface.jpg 350 × 227; 25 KB
 FPNM turning pool.jpg 243 × 245; 16 KB
 Field survey.jpg 307 × 215; 19 KB
 Fieldwork team (c) Ine Pauwels INBO.jpg 4,128 × 2,322; 1.58 MB
 Figure1CIA.jpg 1,017 × 759; 132 KB
 Figure1 CIA.png 5,833 × 4,196; 954 KB
 Figure2CIA.jpg 661 × 431; 75 KB
 Figure3CIA.jpg 947 × 657; 128 KB
 Fish bypass alpha rack.png 1,080 × 962; 457 KB
 Fish bypass beta rack.png 1,019 × 908; 419 KB
 Fish refuge circular flow chart.png 1,299 × 904; 289 KB
 Fish refuge flume config.png 1,209 × 656; 120 KB
 Fish refuge lateral deflectors.png 333 × 472; 457 KB
 Fish refuge overhead cover.png 571 × 373; 372 KB
 Fish refuge overhead cover square.png 369 × 369; 195 KB
 Fish transmitter.jpg 3,881 × 1,343; 525 KB
 Fithydrologo3.jpg 135 × 135; 5 KB
 Fithydrologo large.png 480 × 339; 70 KB
 Fithydrologo transparent 135.png 135 × 135; 4 KB
 Flag of Europe.png 800 × 533; 18 KB
 Flow3 logo.png 411 × 123; 5 KB
 Flow3d banwil1.png 610 × 433; 152 KB
 Flow3d banwil2.png 812 × 433; 46 KB
 Flow3d hpp.png 693 × 433; 116 KB
 Flow3d xyz.png 3,449 × 2,504; 136 KB
 Foster dam spillway ladder square.jpg 1,536 × 1,536; 604 KB
 Fredenau adding sediments.jpg 2,560 × 1,700; 849 KB
 Fredenau fishway.jpg 2,534 × 2,560; 1.13 MB
 Freudenau Fig. 3 Temperature fields of tailwater source TUM.png 1,719 × 1,156; 60 KB
 Freudenau Fig 2 Velocity fields soure TUM.png 1,719 × 1,156; 447 KB
 Freudenau Fig 4 Chemical tracer field of tailwater source TUM.png 1,719 × 1,156; 107 KB
 Fuowps3080oezbz0l5nfzsjyfp35zea.jpg 1,455 × 945; 92 KB
 GLOMMA BYPASS SQUARE.png 377 × 377; 32 KB
 Gauge1.jpg 652 × 486; 177 KB
 Gauge2.png 535 × 406; 566 KB
 Gotein-1-Global-View.jpg 640 × 480; 77 KB
 Gotein-2-Rack-And-Bypasses.jpg 640 × 480; 61 KB
 Gotein-3-Bypasses-And-Collection-Gallery.jpg 1,920 × 2,560; 1.54 MB
 Gotein-4-Baffle fishway.jpg 1,836 × 3,264; 2.36 MB
 Gotein-5-Eelpass.jpg 1,456 × 2,592; 1.55 MB
 Gotein antennas.png 937 × 656; 1.19 MB
 Gps boat remote.png 1,043 × 695; 1.48 MB
 Gps single point.png 912 × 684; 1.61 MB
 Gravel square.png 396 × 396; 360 KB
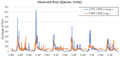
 Guma results 1.png 1,502 × 584; 120 KB
 Guma results 2.png 1,436 × 1,159; 265 KB
 Guma results 2 2018.png 1,436 × 578; 133 KB
 Guma results 2 2019.png 1,436 × 572; 152 KB
 Gunz-nature-like-fishway.jpg 3,737 × 2,449; 3.11 MB
 Gunz elizee HPP.jpg 3,628 × 1,327; 1.17 MB
 Gunz hosenhurst hpp.jpg 3,995 × 1,693; 3.15 MB
 Gunz oberegg hpp.jpg 3,475 × 1,709; 1.58 MB
 Günz-layout.png 1,178 × 1,155; 1.32 MB
 Günz (C)flussbauiC VillachAustria3.jpg 1,750 × 1,167; 624 KB
 HBR BS sketch.png 752 × 486; 358 KB
 HBR params.png 1,844 × 783; 90 KB
 HBR schiffmühle.png 866 × 649; 1.17 MB
 HPP-Ellzee-nature-like-fishway.jpg 3,250 × 2,234; 3.16 MB
 HPP-hoselhurst-nature-like-fishway.jpg 4,000 × 2,250; 3.79 MB
 HPP Bannwil River Aare.jpg 1,625 × 1,015; 544 KB
 HPP Bannwil River Aare2.jpg 1,024 × 683; 593 KB
 HPP Bannwil River Aare3.jpg 1,500 × 1,000; 1.16 MB
 HabitatZones.png 973 × 529; 1,006 KB
 Habitat icon.png 1,297 × 1,299; 2.17 MB
 Habitat measures.jpg 525 × 525; 139 KB
 Ham1 Arial picture HPP cDe-Vlaamse-Waterweg.jpg 1,500 × 1,001; 237 KB
 Ham2 cDe-Vlaamse-Waterweg.jpg 2,736 × 1,824; 2.63 MB
 Ham3 cDe-Vlaamse-Waterweg.jpg 2,736 × 1,824; 2.88 MB
 Ham4 Ship lock complex cDe-Vlaamse-Waterweg.jpg 1,636 × 1,088; 266 KB
 Ham5 2Dtrack.jpg 640 × 367; 46 KB
 Hecras cross sections.png 848 × 564; 205 KB
 Hecras mapper.jpg 980 × 706; 211 KB
 Hecras output.png 1,363 × 1,101; 1.03 MB
 Hecras profiles.png 1,501 × 867; 741 KB
 Hecras rating curve.png 946 × 641; 232 KB
 Hecras stage.png 1,498 × 915; 641 KB
 Horizontal bar rack schiffmuhle.png 1,027 × 770; 1.58 MB
 Horizontal bar rack schiffmuhle square.png 768 × 768; 1.01 MB
 Hydropeaking indicator evolution.png 804 × 509; 62 KB
 Hydropeaking indicator ex1.png 834 × 465; 135 KB
 Hydropeaking indicator ex2.png 585 × 450; 27 KB
 Hydropeaking indicator levels.png 600 × 275; 23 KB
 Hydropeaking tool assessment.png 451 × 360; 16 KB
 Hydropeaking tool principle.png 1,314 × 738; 56 KB
 Hydrophone belgium.jpg 745 × 530; 87 KB
 Hydrophone europe.jpg 611 × 583; 71 KB
 IBR las rives.png 457 × 311; 295 KB
 IBR schematic.png 839 × 397; 30 KB
 IDA damage.png 779 × 538; 26 KB
 IDA fish path.png 886 × 524; 379 KB
 IDA pilot.png 536 × 714; 934 KB
 Icon downstream.png 250 × 250; 10 KB
 Icon habitat.png 250 × 250; 12 KB
 Icon operation.png 250 × 250; 11 KB
 Icon sediment.png 250 × 250; 10 KB
 Icon upstream.png 250 × 250; 10 KB
 Image description.png 1,177 × 1,014; 1.02 MB
 Iron laeral line probe.png 1,385 × 537; 633 KB
 Iron lateral line probe square.png 536 × 536; 329 KB
 Iron pressure assymetry.png 1,373 × 1,068; 122 KB
 Iron pressure graph.png 1,387 × 378; 149 KB
 Jumping Salmon 300.jpg 300 × 300; 50 KB
 LasRives1.jpg 1,497 × 1,123; 607 KB
 LasRives2.jpg 457 × 311; 33 KB
 LasRives3.jpg 465 × 311; 45 KB
 LasRives4.jpg 467 × 351; 54 KB
 LasRives5.jpg 465 × 311; 40 KB
 LasRives6.jpg 467 × 313; 43 KB
 LasRives7.jpg 687 × 411; 74 KB
 LasRives8.jpg 1,641 × 782; 149 KB
 LasRives9.jpg 383 × 453; 53 KB
 Las rives ADCP output1.png 945 × 678; 212 KB
 Las rives ADCP output2.png 945 × 678; 211 KB
 Las rives ADCP support.png 1,380 × 708; 2.04 MB
 Layout-2-Freudenau Verbund.png 806 × 560; 1.01 MB
 Layout-Picture Schiffmühle CVAW ETHZ web-scaled.jpg 2,560 × 1,825; 761 KB
 Layout 3 Freudenau cVerbund web.jpg 1,393 × 1,118; 553 KB
 Lepine bottom intake.png 638 × 476; 641 KB
 Lidar als.png 513 × 600; 64 KB
 Lidar red green.png 486 × 711; 63 KB
 Lidar setup.png 922 × 481; 158 KB
 Log jamming square.jpg 1,926 × 1,926; 2.91 MB
 Longitudinal-section-of-HPP-Freudenau c Verbund.png 1,617 × 975; 445 KB
 Lundesokna high low.png 1,248 × 402; 1.19 MB
 M30qiwaenwgssspe7rdz8boqa3izu09.jpg 750 × 568; 33 KB
 MGR vertical.png 313 × 623; 209 KB
- MTD example.docx ; 1.54 MB
 MTD stages.png 1,471 × 265; 13 KB
 Main factors.png 804 × 753; 28 KB
 Mechanical fish counter gaula.png 720 × 576; 962 KB
 Mechanical fish counter gaula square.png 573 × 573; 639 KB
 Minimizing sediment check dam square.jpg 959 × 959; 639 KB
 Minimizing sediments check dam.jpg 1,280 × 960; 455 KB
 Mitigating flood orkla.png 908 × 435; 39 KB
 NBS types.jpg 343 × 557; 20 KB
 Na3q3w82lj8yfe7aw0f5u55v8opouzx.jpg 688 × 924; 76 KB
 Nature like fishway gunz square.jpg 975 × 975; 552 KB
 Numerical modelling bannwil.jpg 1,524 × 655; 288 KB
 Off-channel square.png 709 × 709; 882 KB
 Off river habitats.png 1,185 × 711; 1.88 MB
 OpenFoam.png 860 × 276; 146 KB
 Openfoam grid.png 583 × 580; 575 KB
 Openfoam logo.png 428 × 87; 11 KB
 Openfoam paraview.png 1,072 × 693; 240 KB
 Openfoam structure.png 439 × 664; 58 KB
 Openfoam structure2.png 3,544 × 1,653; 144 KB
 Overview Altusried (c)OLAV KÖNIG.jpg 4,000 × 2,250; 2.75 MB
- PAGEBANNERPAGEBANNER File missing
 PIT.jpg 472 × 254; 12 KB
 PIT antennas.jpg 504 × 285; 42 KB
 PIT antennas.png 504 × 285; 320 KB
 Peaking params.png 989 × 288; 11 KB
 Peaking params table.png 736 × 514; 40 KB
 Pic BH.jpg 240 × 240; 34 KB
 Piv 2d system.png 824 × 452; 104 KB
 Piv airborne.png 1,001 × 590; 305 KB
 Piv large scale.png 752 × 385; 164 KB
 Policy logo.png 480 × 480; 9 KB
 Pool type fishway norway.png 1,405 × 923; 3.28 MB
 Pool type fishway norway square.png 920 × 920; 1.9 MB
 Qboard.png 910 × 642; 70 KB
 Quotes.png 605 × 452; 87 KB
 R7qr0es9lxajyqjpfyznmpg05wvuog0.jpg 960 × 720; 279 KB
 RFID reader.jpg 1,387 × 832; 278 KB
 RFID scheme.png 1,455 × 945; 136 KB
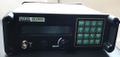 Radio receiver.jpg 1,058 × 503; 113 KB
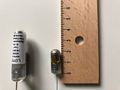 Radio transmitter.jpg 660 × 495; 79 KB
 Restoration riparian stjordal.png 835 × 600; 1.26 MB
 Rinver in river.png 557 × 397; 608 KB
 Rinver in river square.png 389 × 389; 398 KB
 Riparan square.png 600 × 600; 759 KB
 Ripper square.jpg 620 × 620; 209 KB
 Ripping before after.png 463 × 697; 721 KB
 River2d depth.jpg 1,302 × 600; 64 KB
 River2d layout.jpg 1,189 × 496; 78 KB
 River2d velocity.jpg 1,302 × 600; 63 KB
 River2d wua.jpg 925 × 450; 40 KB
 River2d wua discharge.png 513 × 342; 11 KB
 Rock placement.png 565 × 338; 478 KB
 Rock placement3.png 565 × 338; 365 KB
 Rocks square.png 1,004 × 1,004; 2.34 MB
 SHP aerial1.jpg 1,386 × 924; 392 KB
 SHP aerial2.jpg 1,386 × 924; 412 KB
 SHP functionality.png 983 × 536; 171 KB
 SHP install.jpg 1,100 × 734; 221 KB
 SHP planned.png 958 × 585; 1.5 MB
 SMTD logo.png 480 × 480; 11 KB
 Schiffmuhle Calibration-of-sediment-monitoring-system-for-vortex-tube.jpg 2,560 × 1,707; 865 KB
 Schiffmuhle downstream-migration-devices photo 2.jpg 1,920 × 823; 332 KB
 Schiffmuhle sediment-management vortex tube photo 4.jpg 3,840 × 2,160; 2.24 MB
 Schiffmuhle sediment-management vortex tube setup.jpg 2,560 × 2,056; 1 MB
 Schiffmuhle vertical slot fishway.jpg 2,560 × 1,707; 899 KB
 Schiffmühle HPP narrow.jpg 1,386 × 1,386; 579 KB
 Schiffmühle aerial.png 1,362 × 877; 2.61 MB
 Schillmuhle fishway.jpg 1,672 × 1,072; 1.13 MB
 Schillmuhle spillway.jpg 2,016 × 1,512; 801 KB
 Schillmuhle upstream-migration-devices c ETHZ web-scaled.jpg 2,560 × 1,159; 594 KB
 Sediment adding gravel iller.png 1,363 × 1,022; 2.55 MB
 Sediment adding gravel iller square.png 1,016 × 1,016; 1.63 MB
 Sediments2 Square.jpg 530 × 530; 131 KB
 Sediments 300.jpg 300 × 300; 42 KB
 Sediments icon.png 1,302 × 1,302; 1.92 MB
 Sediments trapped giorgia.png 791 × 594; 1,016 KB
 Sf mesh.png 1,746 × 1,274; 2.24 MB
 Sfm drone picture.png 1,385 × 779; 2.23 MB
 Sfm evaluation.png 1,188 × 444; 227 KB
 Sfm workflow.png 349 × 377; 63 KB
 Shelter measurements salmon.png 1,024 × 505; 234 KB
 Shelter measurements shelter tube.png 1,155 × 867; 2.61 MB
 Shelter tube.png 783 × 459; 922 KB
 Shelter tube 300.png 300 × 300; 237 KB
- Solutions examples.docx ; 1.06 MB
 Spawning gravel escavator square.png 786 × 786; 929 KB
 Spawning gravel excavator.png 1,198 × 802; 2.26 MB
 Spawning gravel openfoam.png 284 × 818; 122 KB
 Ssiim ex1.png 445 × 423; 125 KB
 Ssiim ex2.png 565 × 532; 78 KB
 Ssiim ex3.png 638 × 515; 132 KB
 Ssiim flowchart.png 858 × 392; 25 KB
 Ssiim parameters.png 298 × 842; 91 KB
 Stranding ex.png 912 × 625; 1.4 MB
 Stranding ex square.png 622 × 622; 943 KB
 Suction dredging square.jpg 1,077 × 1,077; 1.15 MB
- Tables for SMTD input.xlsx ; 26 KB
 Telemac2d.png 470 × 348; 249 KB
 Telemac2dplus.png 434 × 433; 133 KB
 Telemac3d.png 600 × 463; 462 KB
 Telemac3dplus.png 487 × 433; 340 KB
 Telemetry albert.jpg 602 × 345; 62 KB
 Telemetry iller.jpg 1,092 × 764; 116 KB
 Test Cases logo.png 480 × 480; 6 KB
 Test case presentation Bannwil HPP.pdf ; 11.63 MB
- Test case presentation Schiffmühle.pdf ; 24.28 MB
- Testcase presentation Altheim.pdf ; 3.63 MB
- Testcase presentation Altusried.pdf ; 3.91 MB
- Testcase presentation Anundsjö.pdf ; 1.52 MB
- Testcase presentation Bannwil.pdf ; 7.25 MB
- Testcase presentation Bragado.pdf ; 2.62 MB
- Testcase presentation Freudenau.pdf ; 2.67 MB
- Testcase presentation GOT V4.pdf ; 2.69 MB
- Testcase presentation Gotein.pdf ; 3.11 MB
- Testcase presentation Günz.pdf ; 4.21 MB
- Testcase presentation Ham.pdf ; 2.73 MB
- Testcase presentation Las Rives.pdf ; 7.53 MB
- Testcase presentation Schiffmühle.pdf ; 13.68 MB
- Testcase presentation Trois Villes.pdf ; 4.43 MB
- TesterTester File missing
 Tp6gmmj266rdtzlb1phoyhhv56yzn4v.png 780 × 780; 1.14 MB
 Trois ville baffle fishway.jpg 1,874 × 1,874; 2.87 MB
 Trois ville gate.jpg 1,536 × 2,048; 673 KB
 Trois villes bar-rack.jpg 1,456 × 2,592; 1.5 MB
 Trout shelter square.png 680 × 680; 917 KB
 Truck Transport square.jpg 959 × 959; 159 KB
 Tuning capacitor.jpg 1,256 × 942; 283 KB
 Turbinen cVerbund web-scaled.jpg 2,560 × 1,702; 354 KB
 Upstream icon.png 1,302 × 1,302; 1.61 MB
 Upstream migration fishway.png 709 × 709; 1.11 MB
 Velocity fields bannwil.jpg 1,241 × 905; 364 KB
 Vertical slot fishway.jpg 1,704 × 2,272; 632 KB
 Vertical slot fishway square.jpg 1,630 × 1,630; 774 KB
 Vie implant 1.jpg 505 × 682; 47 KB
 Vie implant 2.jpg 409 × 678; 33 KB
 Vie implant 3.jpg 504 × 541; 25 KB
 Vie implant 4.jpg 507 × 538; 36 KB
 Water flow monitoring.png 486 × 589; 750 KB
 Weir removal.jpg 448 × 448; 124 KB
 Weir removal ex.png 1,372 × 754; 243 KB
 Weir removal mandal square.png 780 × 780; 1.14 MB
 Weir removal mandal square small.png 624 × 624; 674 KB
 Weirs nea.png 916 × 569; 1.29 MB
 Whoosh process.png 937 × 1,249; 290 KB
 Whooshh closeup.jpg 556 × 330; 76 KB
 Whooshh closeup.png 901 × 535; 1.08 MB
 Whooshh installation.png 1,005 × 983; 2.33 MB
 Whooshh process.png 914 × 1,218; 202 KB
 Whooshh schematic.png 1,516 × 662; 97 KB
 Wiki overview.png 1,299 × 707; 25 KB
 Workinpgoress.png 702 × 242; 10 KB
 Wsf crosswall.png 552 × 434; 19 KB
 Wsf double.png 338 × 507; 413 KB
 Wsf single paired.png 432 × 632; 40 KB


_Ine_Pauwels_INBO.jpg)


_Ine_Pauwels_INBO.jpg)


flussbauiC_VillachAustria3.jpg)


_in_the_Iller_(c)Ine_Pauwels,_INBO.jpg)


OLAV_K%C3%96NIG.jpg)


