Structure from motion (SfM)
Contents
Quick summary
Developed by: Various Companies
Date:
Suitable for the following measures:
Introduction
The technique of structure from motion was developed for the gaming industry to allow fast and easy 3D detection and evaluation of bodies. With this technique, it is possible, based on pictures of an object taken with a camera to combine these pictures and based on a software evaluation There are several approaches to generate a 3D model from SfM. In incremental SFM (Schönberger & Frahm 2016), camera poses are solved and added one by one. In global SFM (Govindu 2001), the poses of all cameras are solved for at the same time.
The best result can be achieved when taking pictures from every angle around the object. However, this is not possible for rivers, depending on the river bank vegetation only a flight directly above but with no relevant angle to the sides is possible (Figure 69).
The same problem might appear when using the technique in the lab (Figure 70).
For a sufficient accuracy of the results, at least a camera with a high quality GPS sensor needs to be used. The use of targets or even coded targets would be more favourable, however. Without a clear positioning of the pictures in the space, the result would not be correct as the cameras could not be located correctly in dependency to each other. Targets on the ground, especially for field measurements, are highly recommended. The position of the targets can be measured with a GPS and the targets can be redetected later in the pictures.
Depending on the software used this process of “re-finding” can be done automatically or needs to be done manually.
Again, there are different types of software available, commercial and non-commercial ones. As there is a very fast development and most non-commercial tools need a lot of experience with picture modifications etc. it is recommended, despite the costs, to use a commercial one such as Agisoft Photoscan for instance. In this software, the user can follow relatively easy the workflow provided by the program (Figure 71) to produce a DEM.
Application
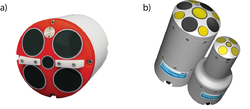
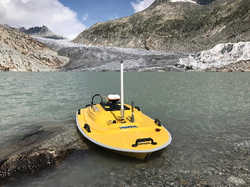
Within the scope of FIThydro, high resolution 3D velocity, as well as bathymetry measurements, have been conducted using an ADCP mounted on a high speed remote-controlled boat at two hydropower plants (HPP) in Switzerland since the beginning of 2018. The models of the ADCP and the boat are River Pro 1200 kHz including piston style four-beam transducer with a 5th, independent 600 kHz vertical beam and Q-Boat purchased from Teledyne Marine, USA, respectively (Figure 2). An external Differential GPS (DGPS) system from A326 AtlasLink (Hemisphere) was used to accurately measure the positions of the ADCP. One set of the battery for the Q-boat allowed us to make measurements for 4 hours up to 10 hours depending on the flow velocity and field conditions i.e. temperature.
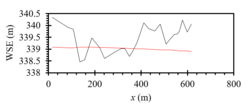
Compass calibration and moving bed tests are conducted before each ADCP measurement at the case study HPPs. The Test Case study HPP Schiffmühle is located on the 35 km long river Limmat between in Untersiggenthal and Turgi near Baden in Switzerland (see the Test Case presentation file for HPP Schiffmühle). Two transects of ADCP at each densely spaced cross-section along the river were enough but high accuracy of altitude data was required for the bathymetry measurements at the HPP and in general. The present DGPS system resulted in ±1m of errors in altitude measurements (Figure 3, black line). Therefore, use of a total station, which is time consuming, or real-time kinematic (RTK) GPS is recommended to accurately determine water surface and hence bathymetry (Figure 3, red line from total station measurements).
Furthermore, the test results from the HPP Bannwil located on River Aare in canton Bern indicated that averaging of at least 8 transects or even more at each cross-section is needed to obtain robust and smooth velocity field and accurate discharge data at highly turbulent and 3D flows occurring in rivers, turbine inlet and outlets or other hydraulic structures (see the Test Case presentation file for HPP Bannwil).
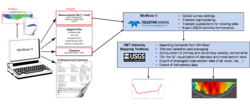
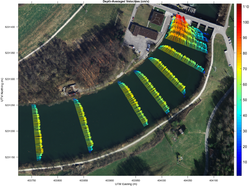
The ADCP data from both HPPs Schiffmühle and Bannwil are post-processed according to the workflow sketched in Figure 4 using the software WinRiver II (Teledyne software) and velocity mapping toolbox (VMT, Matlab based software for processing and visualizing ADCP data provided by U.S. Geological Survey). Figure 5 shows the depth-averaged velocities at the HPP Bannwil plotted with VMT. VMT can be used with the output files from Sontek ADCPs. For further data analysis and presentation on the maps like river bed changes, Q-GIS (free software) or ARC-GIS (Commercial software) are also recommended.
The present system based on the remote-controlled boat platform has advantages over the tethered boat ADCP application. These are less man-power needed, faster and more measurements in a shorter time, no flow disturbance and interference with beams and smoother movement of the boat.
Other information
The total costs for the geophone and accelerometer sensors amount to approx. 885-1'330 €. The costs for the field computer, the analog-digital-converter, and the 3G modem are approx. 5'300-6'200 €. The total costs for the Teledyne RiverPro 1200 kHz, Teledyne Q-boat and DGPS from Hemisphere Atlas link amount to approx. 22’000 €, 21’200 € and 3’340 € respectively. The costs of shipping, VAT, some mounting apparatus and long-range radio modem are excluded. For current costs of the equipment, we recommend to ask the corresponding supplier. Note that Q-boat can also house Sontek RiverSurveyor M9. Furthermore, a rugged laptop for field use is recommended.
Relevant literature
- Mueller, D.S., Wagner, C.R., Rehmel, M.S., Oberg, K.A., Rainville, F. (2013). Measuring discharge with acoustic Doppler current profilers from a moving boat (ver. 2.0, December 2013), U.S. Geological Survey Techniques and Methods, book 3, chap. http://dx.doi.org/10.3133/tm3A22.
- Simpson, M.R. (2002). Discharge measurements using a broadband acoustic Doppler current profiler. Open-file Report 2001-1, https://doi.org/10.3133/ofr011.
Links to the suppliers of equipment:
- Teledyne Marine, ADCP RiverPro: http://www.teledynemarine.com/riverpro-adcp?ProductLineID=13
- Teledyne Marine, Q-Boat: http://www.teledynemarine.com/Lists/Downloads/Q-Boat_1800_Datasheet.pdf
- Hemisphere Atlas DPS: https://hemispheregnss.com/Atlas/atlaslinke284a2-gnss-smart-antenna-1226
- Sontek ADCP M9: https://www.sontek.com/riversurveyor-s5-m9
Software for ADCP data analysis:
- Velocity Mapping Toolbox: https://hydroacoustics.usgs.gov/movingboat/VMT/VMT.shtml
- Q-GIS: https://qgis.org/en/site/
