Difference between revisions of "Dilution gauging"
Bendikhansen (talk | contribs) |
Bendikhansen (talk | contribs) |
||
| Line 1: | Line 1: | ||
=Quick summary= | =Quick summary= | ||
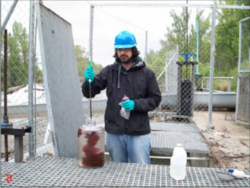
[[file:dilution_gauging2.png|thumb|250px|Figure 1: Dilution gauging in a fishway: making the dilution of the tracer (Rhodamine Wt).]] | [[file:dilution_gauging2.png|thumb|250px|Figure 1: Dilution gauging in a fishway: making the dilution of the tracer (Rhodamine Wt).]] | ||
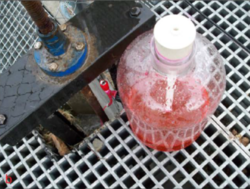
| − | [[file:dilution_gauging3.png|thumb|250px|Figure | + | [[file:dilution_gauging3.png|thumb|250px|Figure 2: Dilution gauging in a fishway: Mariotte device for the continuous injection into the fishway.]] |
Developed by: | Developed by: | ||
| Line 31: | Line 31: | ||
=Application= | =Application= | ||
| − | This method has been used for ITAGRA-GEA to measure discharge into the fishways (Bravo-Córdoba y Sanz-Ronda, 2011; Fuentes-Pérez et al., 2016 and 2017; Sanz-Ronda et al., 2016; Bravo-Córdoba et al., 2018). One of the main aims was to improve the accuracy of the discharge coefficients related to technical fishways into the field. It was done through the continuous method, using Rodamine WT as a tracer and a portable fluorometer to measure the fluorescence of the samples (Figure 1). | + | This method has been used for ITAGRA-GEA to measure discharge into the fishways (Bravo-Córdoba y Sanz-Ronda, 2011; Fuentes-Pérez et al., 2016 and 2017; Sanz-Ronda et al., 2016; Bravo-Córdoba et al., 2018). One of the main aims was to improve the accuracy of the discharge coefficients related to technical fishways into the field. It was done through the continuous method, using Rodamine WT as a tracer and a portable fluorometer to measure the fluorescence of the samples (Figure 1 and 2). |
=Other information= | =Other information= | ||
Revision as of 12:44, 18 June 2019
Contents
Quick summary
Developed by:
Date:
Type: Method
Suitable for the following [[::Category:Measures|measures]]:
Introduction
This method requires the release of a known tracer concentration in a section of the river or fishway and the subsequent determination of the tracer concentration in a downstream section. It is based on the dilution relationships between the injection of the tracer and the discharge we want to know. There are two main different methods for the injection of the tracers into the flow: (a) instantaneous or integration method and (b) continuous method.
The discharge for (a) is calculated as:
Q= c_0/c∙V/T
Being c_0 the tracer concentration which is introduced in the watercourse with discharge Q. c is the concentration of the sample in volume V and T is equal to the time needed for the tracer to be transported downstream.
The formulae discharge for (b):
Q=q.c_1/c_2
Being c_1 the tracer concentration in the injection, q the constant injection flow for the tracer (e.g. using a Mariotte device) and c_2 the tracer concentration at the downstream point.
The choice of the tracer depends on several factors: the chemical characteristics of the water, the suspended sediment, the distance between the injection and measuring section, the type of flow to be measured, the sensitivity of the tracer measurement devices and the possible environmental impact of the tracer. Common tracers used: chemical (NaCl, NaI, NH4Cl) and fluorescent (fluorescein and Rhodamine WT).
It is important to verify some conditions: the tracer cannot be absorbed in the medium and the solution must be well mixed. Emphasizing the last one, it is necessary to assure the good mixing length, which is the distance between the injection and measure sections ensuring a stable concentration of the diluted tracer.
Application
This method has been used for ITAGRA-GEA to measure discharge into the fishways (Bravo-Córdoba y Sanz-Ronda, 2011; Fuentes-Pérez et al., 2016 and 2017; Sanz-Ronda et al., 2016; Bravo-Córdoba et al., 2018). One of the main aims was to improve the accuracy of the discharge coefficients related to technical fishways into the field. It was done through the continuous method, using Rodamine WT as a tracer and a portable fluorometer to measure the fluorescence of the samples (Figure 1 and 2).
Other information
Relevant literature
- ISO 9555:1994. Measurement of liquid flow in open channels — Tracer dilution methods for the measurement of steady flow
- Tazioli, A. (2011). Experimental methods for river discharge measurements: Comparison among tracers and current meter. Hydrological Sciences Journal – Journal des Sciences Hydrologiques. 56. 1314-1324.
- Bravo‐Córdoba FJ, Sanz‐Ronda FJ. 2011. Evaluación de la eficiencia biológica de una escala de hendiduras verticales para la trucha autóctona (Salmo trutta L.) en la Cuenca del Duero. Master’s thesis. University of Valladolid, Spain.
- Bravo‐Córdoba FJ, Sanz‐Ronda FJ, Ruiz‐Legazpi J, Celestino LF, Makrakis S. 2018. Fishway with two entrance branches: Understanding its performance for potamodromous Mediterranean barbels. Fisheries Management and Ecology 25(1): 12–21.
- Fuentes-Pérez JF, Sanz-Ronda FJ, Martínez de Azagra-Paredes A, García-Vega A, Martínez de Azagra A, García-Vega A. 2016. Nonuniform hydraulic behavior of pool-weir fishways: a tool to optimize its design and performance. Ecol Eng 86: 5–12.
- Fuentes-Pérez JF, García-Vega A, Sanz-Ronda FJ, Martínez de Azagra Paredes A. 2017. Villemonte’s approach: a general method for modelling uniform and non-uniform performance in stepped fishways. Knowl. Manag. Aquat. Ecosyst., 418, 23.
- Sanz-Ronda FJ, Bravo-Córdoba FJ, Fuentes-Pérez JF, Castro-Santos T. 2016. Ascent ability of brown trout, Salmo trutta, and two Iberian cyprinids− Iberian barbel, Luciobarbus bocagei, and northern straight-mouth nase, Pseudochondrostoma duriense− in a vertical slot fishway. Knowledge and Management of Aquatic Ecosystems (417): 10.

