Difference between revisions of "File:Cosh tool peaks day.png"
Jump to navigation
Jump to search
| Line 2: | Line 2: | ||
|author= Julie Charmasson | |author= Julie Charmasson | ||
|source=SINTEF Energy Research | |source=SINTEF Energy Research | ||
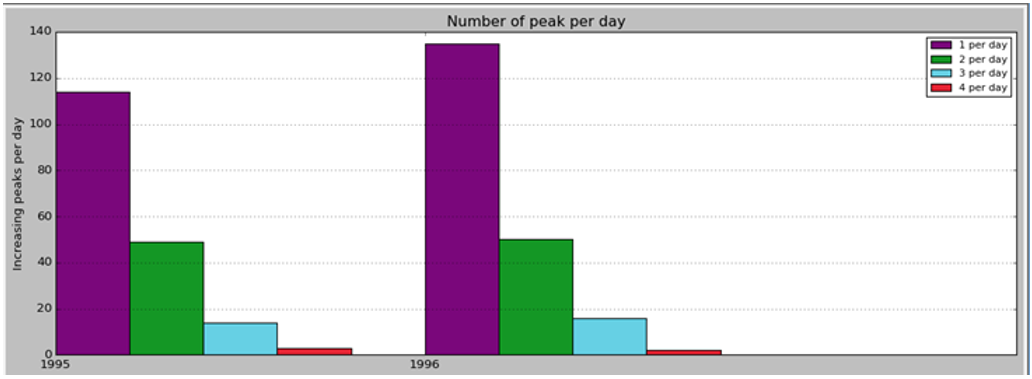
| − | |description= | + | |description=Number of peak events per day for each year of the time series |
}} | }} | ||
Latest revision as of 16:01, 11 April 2020
| Description |
Number of peak events per day for each year of the time series |
| Author |
Julie Charmasson |
| Source |
SINTEF Energy Research |
File history
Click on a date/time to view the file as it appeared at that time.
| Date/Time | Thumbnail | Dimensions | User | Comment | |
|---|---|---|---|---|---|
| current | 11:05, 20 June 2019 | 1,032 × 379 (64 KB) | Bendikhansen (talk | contribs) |
- You cannot overwrite this file.
File usage
The following page uses this file: