Current meter
Contents
Quick summary
Developed by:
Date:
Type: Device
Introduction
The first devices to measure flow velocities appeared during the 1780s, with the first mechanical current meter which counts the rotations of a propeller and links it to the flow velocity (by proportionality principle).
Today there are 3 different techniques to assess the flow velocity: mechanically, electromagnetically, and acoustically (Figure 1). The acoustic current meters using the Doppler Effect are not presented here, as these tools (e.g ADCP, ADV) are presented separately.
Application
In a mechanical flow meter, the rotation of the propeller produces an electrical impulse detected and recorded by a counter connected to the current meter. The electromagnetic flow meter uses the Faraday law. The sensor creates a magnetic field between two electrodes located at the end of the probe. The flow velocity is deduced from the measurement of the electromagnetic force generated by the passage of water through the magnetic field.
The measurement conditions of discharge through flow velocity fields are regulated by the European standard NF EN ISO 748. The velocities are measured along a cross section at verticals. The number of verticals (n) depends on the width of the channel (w):
- W < 0.5 m, n = 5 or 6
- W > 0.5 m and < 1 m, n = 6 or 7
- W > 1 m and < 3 m, n = 7 or 12
- W > 3 m and < 5 m, n = 13 to 16
- W > 5 m, n ≥ 22
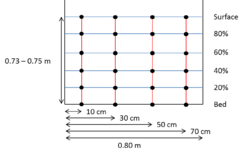
One method among others to measure the mean velocity on each vertical is to measure the velocity in one or several measurement points at different water levels on the vertical. The number of measurements points for each vertical depends on the water level. For example, only one point is needed for water level <20 cm at 60% of the water level. If there are only 2 measurement points, they should be at 20 and 80% of the flow depth, and the mean velocity corresponds to the average of the two measured velocities. In the following example, 6 measurements were selected (Figure 2). The example is linked to the velocity profile inside a downstream migration channel, which is not logarithmic.
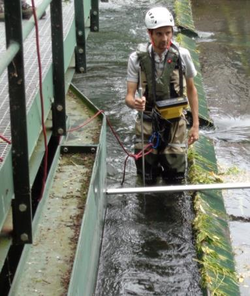
To do the measurements, the operator needs to be equipped with waders and to be in the stream (Figure 3).
By the method of mean section, the mean velocity between the banks and the closer verticals can be calculated. The mean velocity on each vertical is calculated that way, in the case of 6 measurement points:
Then a mean velocity is calculated for each flow section between the verticals and the closer bank; by making an average for the sections without including the banks, and by applying the following formula:
where m is a parameter depicting the characteristics of the river bed or of the wall. m is generally comprised between 5 and 7, but can be equal to 10 if the walls are really smooth. If the river bed and the walls are rough, m=4.
The discharge per section can be calculated according to standard EN ISO 748:2007:
where is the mean water level and is the width of the channel.
The total discharge is the sum of all the discharges per section.
The most recent devices have the possibility to directly treat the data and provide the total discharge.
Relevant mitigation measures and test cases
Other information
Several companies commercialize these technologies.
At the French Test Cases an electromagnetic flow meter Marsh McBirney, FLO-MATE 2000 was used.
Relevant literature
- Aurélien Despax, 2016, Incertitude des mesures de débit des cours d’eau au courantomètre, Amélioration desméthodes analytiques et apports des essais interlaboratoires, Ingénierie de l’environnement, UniversitéGrenoble Alpes, 2016
- Manon Dewitte, Dominique Courret, Fatma Lemkecher, Laurent David, 2019, Presentation of Las Rives Test Case, FIThydro


